[Stock Market](../)
Bitcoin (BTC) Bottom just one step away for BITSTAMP:BTCUSD by humairqureshi
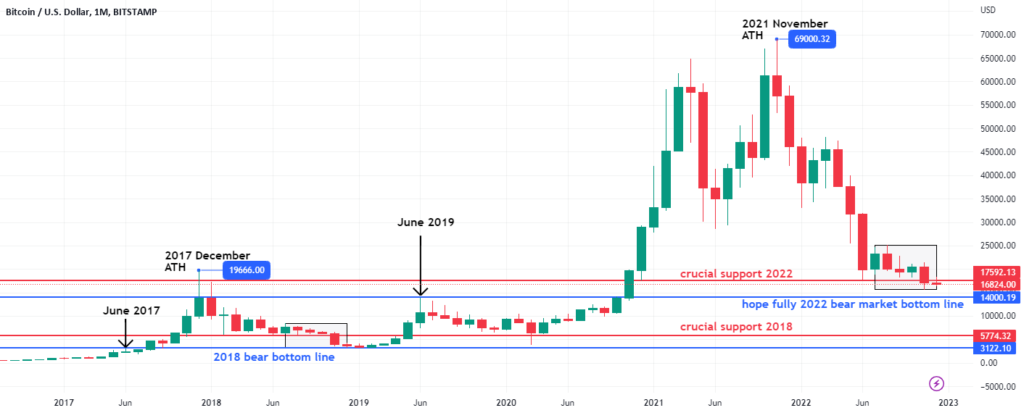
[Bitcoin](//www.tradingview.com/symbols/BTCUSD/)2018 bear market to the 2022 market after June, the 2022 monthly candle is identical to the 2018 market status such as July, August, September, October, and now December.
I’m a data analyst, and I know that if you ask the right question about the right data, you can gain some interesting insight that can help you make a decision to take the next step, so I analyze the previous market data for
[bitcoin ](//www.tradingview.com/symbols/BTCUSD/) to compare with the current market situation, so let’s get started.
Discuss the
[Bitcoin ](//www.tradingview.com/symbols/BTCUSD/) monthly chart from 2018 and 2022 in brief
1-
[Bitcoin ](//www.tradingview.com/symbols/BTCUSD/) monthly chart from (July to December) 2018
First, we focus on the monthly candle from July to December, in which we take some facts, such as: in July, when
[BTC ](//www.tradingview.com/symbols/BTCUSD/) moves up to 46% at a high of $8,496, the $8,496 level makes a [resistance level](//www.tradingview.com/ideas/supportandresistance/) , and the $5,774 June low makes a [support level](//www.tradingview.com/ideas/supportandresistance/) ; the next three months’ candles move in this [support and resistance](//www.tradingview.com/ideas/supportandresistance/) area, as shown in the chart below.
The red line in the charts below shows the June low level, which is the new 2018 bear market low.The next month, if we count wick to wick, the July monthly candle moves positively by more than 46%, with a low of $6,076 and a high of $8,496.
August, September, and October In this three-month market, the Monthly Candle moves in the June support and July resistance areas with choppy very tied-closed movement, then begins the November market with the same tied-closed movement, but on November 14, when the market breaks the June support and makes another new low of the 2018 bear market.November’s monthly candle closed at 37% downside, which is a huge red candle after September 2011.
[BTC ](//www.tradingview.com/symbols/BTCUSD/) makes another new low in December 2018 at $3,122, which is the candle-wick support from June 2017.If we measure the July-December market downside percentage, which is 63% down from July-December.
Summarize 2018 July to December
[Bitcoin ](//www.tradingview.com/symbols/BTCUSD/) Chart
In July 2018, the
[BTC ](//www.tradingview.com/symbols/BTCUSD/) price was up more than 20% after the June low.
BTC moves in a tied range, which is June low and July high.
From August to October, the
[BTC ](//www.tradingview.com/symbols/BTCUSD/) monthly candle closed in the red.
From July to December
[BTC ](//www.tradingview.com/symbols/BTCUSD/) was down more than 62% from the top of July 2018.
November, when
[BTC ](//www.tradingview.com/symbols/BTCUSD/) breaks the June support and makes a new [all-time ](//www.tradingview.com/symbols/NYSE-ALL/) high.
The monthly candle in December marked the bottom of the
[BTC ](//www.tradingview.com/symbols/BTCUSD/) bear market in 2018.
December’s monthly candle breaks November’s new low, and December’s wick bounces from the June 2017 support.
2-
[Bitcoin ](//www.tradingview.com/symbols/BTCUSD/) monthly chart from (July to December) 2022
Following the collapse of Luna in May 2022,
[bitcoin ](//www.tradingview.com/symbols/BTCUSD/) makes a new [all-time ](//www.tradingview.com/symbols/NYSE-ALL/) low in June at the price of $17,592, and July was a good month for [BTC ](//www.tradingview.com/symbols/BTCUSD/) price to gain more than 17% after the previous three months of decline.
From August to October,
[BTC ](//www.tradingview.com/symbols/BTCUSD/) was in a closed-range bond, which ranged from $25,000 to $18,000.June low is working as a support, and July high is working as a resistance.
On November 9, 2022, following the FTX saga,
[BTC ](//www.tradingview.com/symbols/BTCUSD/) broke the June support and set a new low of $15,479, so now everyone is panicking because [BTC ](//www.tradingview.com/symbols/BTCUSD/) broke critical support and crypto is in trouble.
The [Twitter ](//www.tradingview.com/symbols/NYSE-TWTR/) Crypto family claimed [Bitcoin ](//www.tradingview.com/symbols/BTCUSD/) would fall to $10,000, implying extreme fear in the market.
Before we get to the bottom of
[bitcoin ](//www.tradingview.com/symbols/BTCUSD/) , let’s take a look at the 2022 market summary and [BTC ](//www.tradingview.com/symbols/BTCUSD/) 2017 ATH and 2021 ATH comparison.
Summarize 2022 July to December
[Bitcoin ](//www.tradingview.com/symbols/BTCUSD/) Chart
On July 2022, the
[BTC ](//www.tradingview.com/symbols/BTCUSD/) price was up more than 17% after the June low.
BTC moves in a tied range, which is June low and July high.
From August to September, the
[BTC ](//www.tradingview.com/symbols/BTCUSD/) monthly candle closed in the red.
From July to December
[BTC ](//www.tradingview.com/symbols/BTCUSD/) was down more than 38% from the top of August wick 2022.
November, when
[BTC ](//www.tradingview.com/symbols/BTCUSD/) breaks the June support and makes a new [all-time ](//www.tradingview.com/symbols/NYSE-ALL/) high.
Bitcoin 2017 ATH and 2021 ATH
If we compare the 2017 ATH to the 2018 bottom,
[BTC ](//www.tradingview.com/symbols/BTCUSD/) declined by more than 83%.In 2022, the bottom is not confirmed, but we see that from 2021 ATH to 2022 November, [BTC ](//www.tradingview.com/symbols/BTCUSD/) declined by more than 77%.At the time of this writing, the December monthly candle is not closed, so where is the [BTC ](//www.tradingview.com/symbols/BTCUSD/) bottom?
So, where is the 2022 bear market bottom?
In our detailed discussion of the
[BTC ](//www.tradingview.com/symbols/BTCUSD/) 2018 and 2022 bear markets, we got some insight that bitcoin’s bottom is just one step away.
In 2018
[BTC ](//www.tradingview.com/symbols/BTCUSD/) breaks crucial support in November and make a new low level then December was the [bitcoin ](//www.tradingview.com/symbols/BTCUSD/) bottom which makes support from the June 2017 candle wick.
Now
[BTC ](//www.tradingview.com/symbols/BTCUSD/) is the same as the 2018 bear cycle, and I believe Bitcoin’s bottom is near in December, which is $14,000, because June 2019 gives support to this $14,000 level.
If you’re
[bearish](//www.tradingview.com/ideas/bearish/) in this market, it means you don’t know the market cycle when [BTC ](//www.tradingview.com/symbols/BTCUSD/) is on top in November 2021, so that’s a time to be [bearish](//www.tradingview.com/ideas/bearish/) , not at this time.
Glassnode Insight about 2018 and 2022 Bear Market
Gassnode compares the current cycle to all of the major bear markets in the past.
He does this by measuring from the realized capital peak to the trough to get a sense of the relative outflows of capital:
2010-11 saw a net capital outflow equivalent to 24% of the peak.
2014-15 experienced the lowest, yet non-trivial capital outflow of 14%.
2017-18 recorded a 16.5% decline in Realized Cap, the closest to the current cycle of 17.0%.
Conclusion
I’m neither
[bullish](//www.tradingview.com/ideas/bullish/) nor [bearish](//www.tradingview.com/ideas/bearish/) at this time because I believe bitcoin’s bottom is at $14,000, and I believe the market is not recovering quickly from December to April, which is getting boring because I believe [bitcoin ](//www.tradingview.com/symbols/BTCUSD/) will move in a tied-bound range in the coming month compared to the 2018 bear cycle.
If everyone is waiting for
[BTC ](//www.tradingview.com/symbols/BTCUSD/) at a $10,000 price, they never buy it when [BTC ](//www.tradingview.com/symbols/BTCUSD/) is down at a $10,000 price; they think [BTC ](//www.tradingview.com/symbols/BTCUSD/) is down again and they pick the $5,000 price… LOL [World News](/)|| [Latest News](/news)|| [U.S.News](/news/us-news) [Source link](//www.tradingview.com/chart/BTCUSD/DR1eSFHN-Bitcoin-BTC-Bottom-just-one-step-away/).