[](/u/CryptoDiabloo/)
BTCUSDT complete multi technical analysis
[INDEX:BTCUSD](/symbols/BTCUSD/)Bitcoin
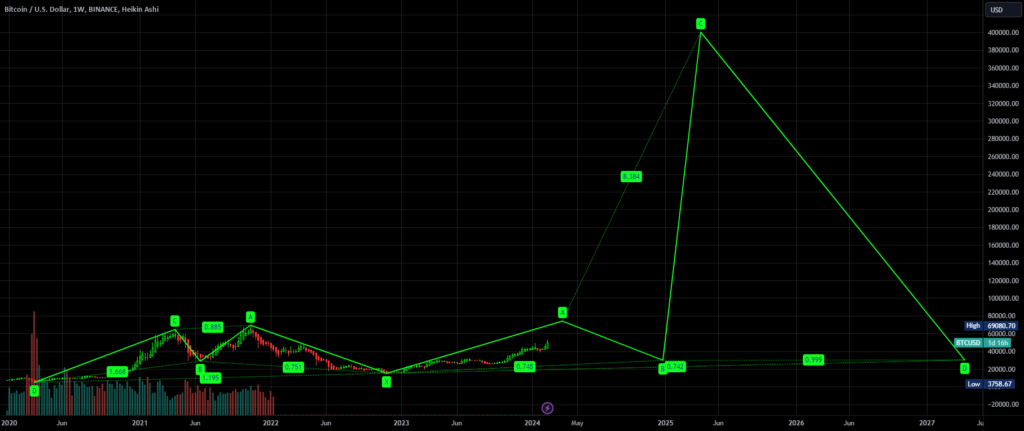
The Bitcoin (BTC) against the U.S.Dollar (USD) chart showcases a dynamic trend within the context of Smart Money Concepts (SMC).The price action is currently above the 0.618 Fibonacci retracement level, which is situated around $42,747.61, suggesting a significant level of support recognized by institutional investors.
The chart demonstrates a clear uptrend, with the Moving Average lines situated below the current price level, further supporting the bullish sentiment.The current price is hovering near the $51,788.66 mark, with a notable resistance level at the 0 mark, which could be interpreted as a psychological round number or a potential area where smart money might take profits.
The Volume Profile Visible Range (VPRV) suggests substantial trading activity at these higher price levels, potentially indicating a consensus of value according to smart money.
The Relative Strength Index (RSI) is approaching overbought conditions, sitting at around 78.61, indicating strong buying pressure but also suggesting that a pullback could be imminent as markets tend to revert after reaching extreme RSI levels.
The MACD is positive, implying continued bullish momentum; however, traders would be mindful of any potential crossover that could signal a shift in trend.
Incorporating SMC, liquidity zones are observed where significant price reactions have occurred, indicating possible areas where large market players may execute trades.
The recent break above previous resistance levels, now acting as support, aligns with the concept of a ‘Break of Structure’ (BOS) within SMC, where smart money may establish new positions or reinforce existing ones.
The candlestick formations show a series of bullish candles, with the most recent one having a small upper wick, suggesting a slight selling pressure but not enough to overturn the prevailing bullish trend.
The current chart configuration, considering the SMC approach, would have traders looking for potential entry points at retracement or liquidity zones with stop losses set below key support levels to mitigate risk.The objective would be to align with the presumed actions of smart money, anticipating further upward movement or preparing for a strategic exit should the trend show signs of reversal.
Disclaimer
The information and publications are not meant to be, and do not constitute, financial, investment, trading, or other types of advice or recommendations supplied or endorsed by TradingView.Read more in the
[Terms of Use](/policies/#disclaimer-regarding-investment-decisions-and-trading)..