 [](/u/Lingrid/)
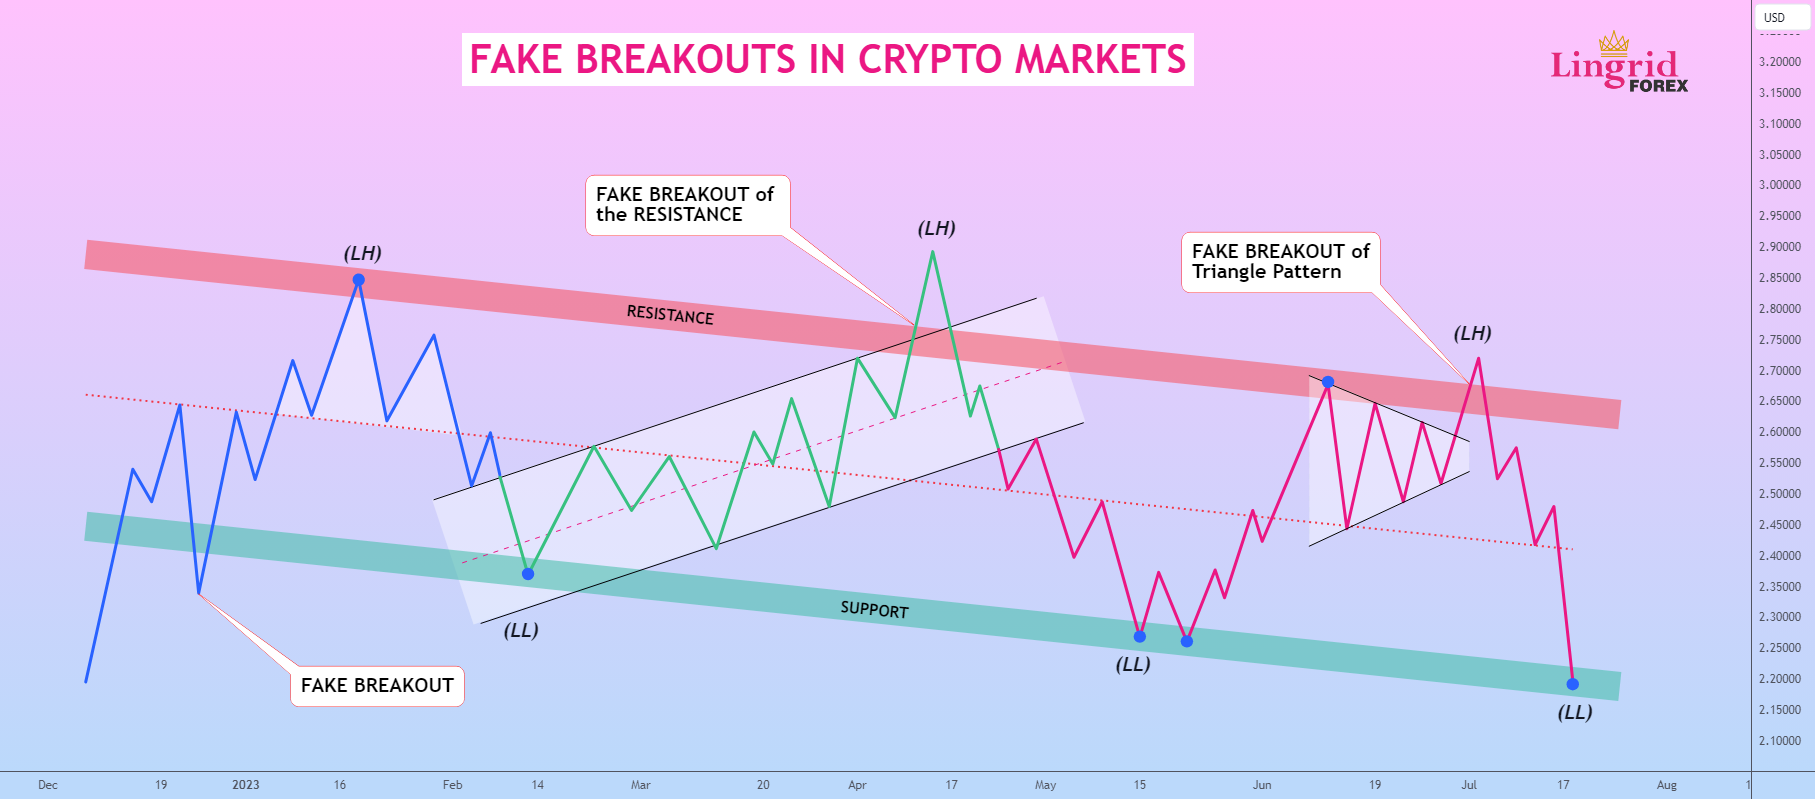
FAKE BREAKOUTS IN CRYPTO MARKETS
[OANDA:EURUSD](/symbols/EURUSD/)Euro / U.S.Dollar
Hello traders! 👋
How often has it happened to you that you watch a certain level and wait for its breakout, and when the price breaks this significant level, the price does not tend in the direction of the breakout? After a while, it goes back down, putting your balance at risk of heavy losses.Now let’s talk about what a fake breakout is in the crypto market in particular..
Definition And Types 📝
A fake breakout is a breakout of some horizontal or sloping level, after which the price immediately or gradually moves away in the opposite direction of the breakout.The candlestick that broke the level is called a breakout candlestick.
The most common fake breakouts in trading:
Fake Trend Breakout 📊
On the chart of
We see an excellent trend breakout, a well-defined breakout candle.
Here any trader has two options:
1.Enter in the direction of the trend.And since we have broken the trend line, the trend has changed to a downtrend.
2.Wait for a possible rebound and return above the trend line.
Let’s start with the fact that it is not profitable to enter trades immediately after the trend breakout, as there is a high chance of such confusing cases.
Therefore, it is advised to wait for a strong rebound and the continuation of the movement in the direction of the breakout.And what to do if the market has a situation as shown in the picture, i.e., the price breaks through and returns back above the trend line? Everything is even simpler here:
A Fake Breakout of Support or Resistance 📈📉
This type of breakout is the most popular, but it has its own interesting trick.As a rule, in such situations, the price chart hints that it wants to break some significant level and all traders freeze waiting for the breakout.The breakout happens, but there is no profit.This is a classic in the current realities, at least in the cryptocurrency markets.
The principle of trade entry is exactly the same.Only the nature of the breakout differs.By the way, as you can see from the post, and if you look at the charts of coins, the largest and strongest movements are usually accompanied by fake breakouts before them.This is due to the fact that thanks to a fake breakout, most panic traders or those who have extremely short stop loses are dropped off.
Fake Breakout of A Pattern 🔎
This fake breakout is the most rare, but it still occurs.
Its essence is that when you see one of the technical analysis figures and, according to its own rules, understand in which direction this figure is most likely to break, it breaks in the opposite direction.
On the
The algorithm of entering the trade is exactly the same as in the other two cases.But here you can resort to one more variant of entry, in addition to overcoming the top or bottom of the breakout candle.Also, if it is pattern from the classic technical analysis, you can simply enter the trade on the crossing of the pattern.
In cryptocurrency markets, the following picture often occurs:
• An important level is formed.
• The price breaks it and fixes itself above or below it.
• There is a pullback to the previous zone with a small continuation of the reverse movement (fake breakout).
• The price returns to this zone again and starts to consolidate.
• A true breakout occurs.
As a result, the stops of both those who did not earn on shorting and those who did not earn on the long position were accumulated.There is only one recommendation to avoid this case, just tighten the stops and do not be greedy.
Remember the main rule, the more tests of the level, the more likely it is to break through.And here is another simple truth: levels are created in order to break them.
In conclusion, fake breakouts are a common phenomenon in trading, particularly in the cryptocurrency markets.They can occur in various forms, such as fake trend breakouts, fake breakouts of support or resistance, and fake breakouts of technical patterns.Understanding these scenarios and adapting appropriate trading strategies can help potentially capitalize on market opportunities.
Recognizing and managing fake breakouts can contribute to more successful trading experiences.
Traders, If you liked this educational post🎓, give it a boost 🚀 and drop a comment
How often has it happened to you that you watch a certain level and wait for its breakout, and when the price breaks this significant level, the price does not tend in the direction of the breakout? After a while, it goes back down, putting your balance at risk of heavy losses.Now let’s talk about what a fake breakout is in the crypto market in particular..
Definition And Types 📝
A fake breakout is a breakout of some horizontal or sloping level, after which the price immediately or gradually moves away in the opposite direction of the breakout.The candlestick that broke the level is called a breakout candlestick.
The most common fake breakouts in trading:
– A fake breakout of a trendline.
– A fake breakout of support or resistance.
– A fake breakout of the borders of a technical pattern.
Fake Trend Breakout 📊
On the chart of
[ETHUSD](/symbols/ETHUSD/)I managed to find a great fake trend breakout during a bull run.The point was that the price started a great growth, then a trend line was formed, from which most traders bought the asset until all the buyers were dropped off the train.
But for the others, who understood the principle of fake breakouts, it was, on the contrary, a great opportunity to enter the market.
We see an excellent trend breakout, a well-defined breakout candle.Here any trader has two options:
1.Enter in the direction of the trend.And since we have broken the trend line, the trend has changed to a downtrend.
2.
Wait for a possible rebound and return above the trend line.
Let’s start with the fact that it is not profitable to enter trades immediately after the trend breakout, as there is a high chance of such confusing cases.Therefore, it is advised to wait for a strong rebound and the continuation of the movement in the direction of the breakout.And what to do if the market has a situation as shown in the picture, i.e., the price breaks through and returns back above the trend line? Everything is even simpler here:
– You wait for the return above the trend line.
– As soon as it happens, you place a limit order on the upper or lower boundary (depends on the trend direction) of the breakout candle.
– You wait for the market to fill up your order.
– You place a stop-loss under or over the trend line (depending on the trend direction).
A Fake Breakout of Support or Resistance 📈📉
This type of breakout is the most popular, but it has its own interesting trick.
As a rule, in such situations, the price chart hints that it wants to break some significant level and all traders freeze waiting for the breakout.
The breakout happens, but there is no profit.This is a classic in the current realities, at least in the cryptocurrency markets.
The principle of trade entry is exactly the same.Only the nature of the breakout differs.By the way, as you can see from the post, and if you look at the charts of coins, the largest and strongest movements are usually accompanied by fake breakouts before them.
This is due to the fact that thanks to a fake breakout, most panic traders or those who have extremely short stop loses are dropped off.
Fake Breakout of A Pattern 🔎
This fake breakout is the most rare, but it still occurs.Its essence is that when you see one of the technical analysis figures and, according to its own rules, understand in which direction this figure is most likely to break, it breaks in the opposite direction.
On the
[SOLUSDT](/symbols/SOLUSDT/)chart, I managed to find a good example of this algorithm.
A descending triangle with a flat bottom was clearly drawn on the chart, which, according to the classic technical analysis, should break towards the flat side, but they decided to give us a “haircut”.
The algorithm of entering the trade is exactly the same as in the other two cases.But here you can resort to one more variant of entry, in addition to overcoming the top or bottom of the breakout candle.
Also, if it is pattern from the classic technical analysis, you can simply enter the trade on the crossing of the pattern.
In cryptocurrency markets, the following picture often occurs:
• An important level is formed.
• The price breaks it and fixes itself above or below it.
• There is a pullback to the previous zone with a small continuation of the reverse movement (fake breakout).
• The price returns to this zone again and starts to consolidate.
• A true breakout occurs.
As a result, the stops of both those who did not earn on shorting and those who did not earn on the long position were accumulated.
There is only one recommendation to avoid this case, just tighten the stops and do not be greedy.Remember the main rule, the more tests of the level, the more likely it is to break through.And here is another simple truth: levels are created in order to break them.
In conclusion, fake breakouts are a common phenomenon in trading, particularly in the cryptocurrency markets.
They can occur in various forms, such as fake trend breakouts, fake breakouts of support or resistance, and fake breakouts of technical patterns.
Understanding these scenarios and adapting appropriate trading strategies can help potentially capitalize on market opportunities.Recognizing and managing fake breakouts can contribute to more successful trading experiences.
Traders, If you liked this educational post🎓, give it a boost 🚀 and drop a comment
📚The BEST Trading Course:
💰FREE signals in Telegram:
🌎WebSite:
🏆TOP Broker:
📱instagram:
t.me/lingrid
💰FREE signals in Telegram:
bit.ly/3F4mrMi
🌎WebSite:
lingrid.org
🏆TOP Broker:
lingridedu.com/brokerFXPro
📱instagram:
www.instagram.com/lingrid_trader/
Disclaimer
The information and publications are not meant to be, and do not constitute, financial, investment, trading, or other types of advice or recommendations supplied or endorsed by TradingView.Read more in the
[Terms of Use](/policies/#disclaimer-regarding-investment-decisions-and-trading)..