 [](/u/Aaron-Hill/)
Major Crypto Analysis
[COINBASE:LTCUSD](/symbols/LTCUSD/)Litecoin
BTC/USD:
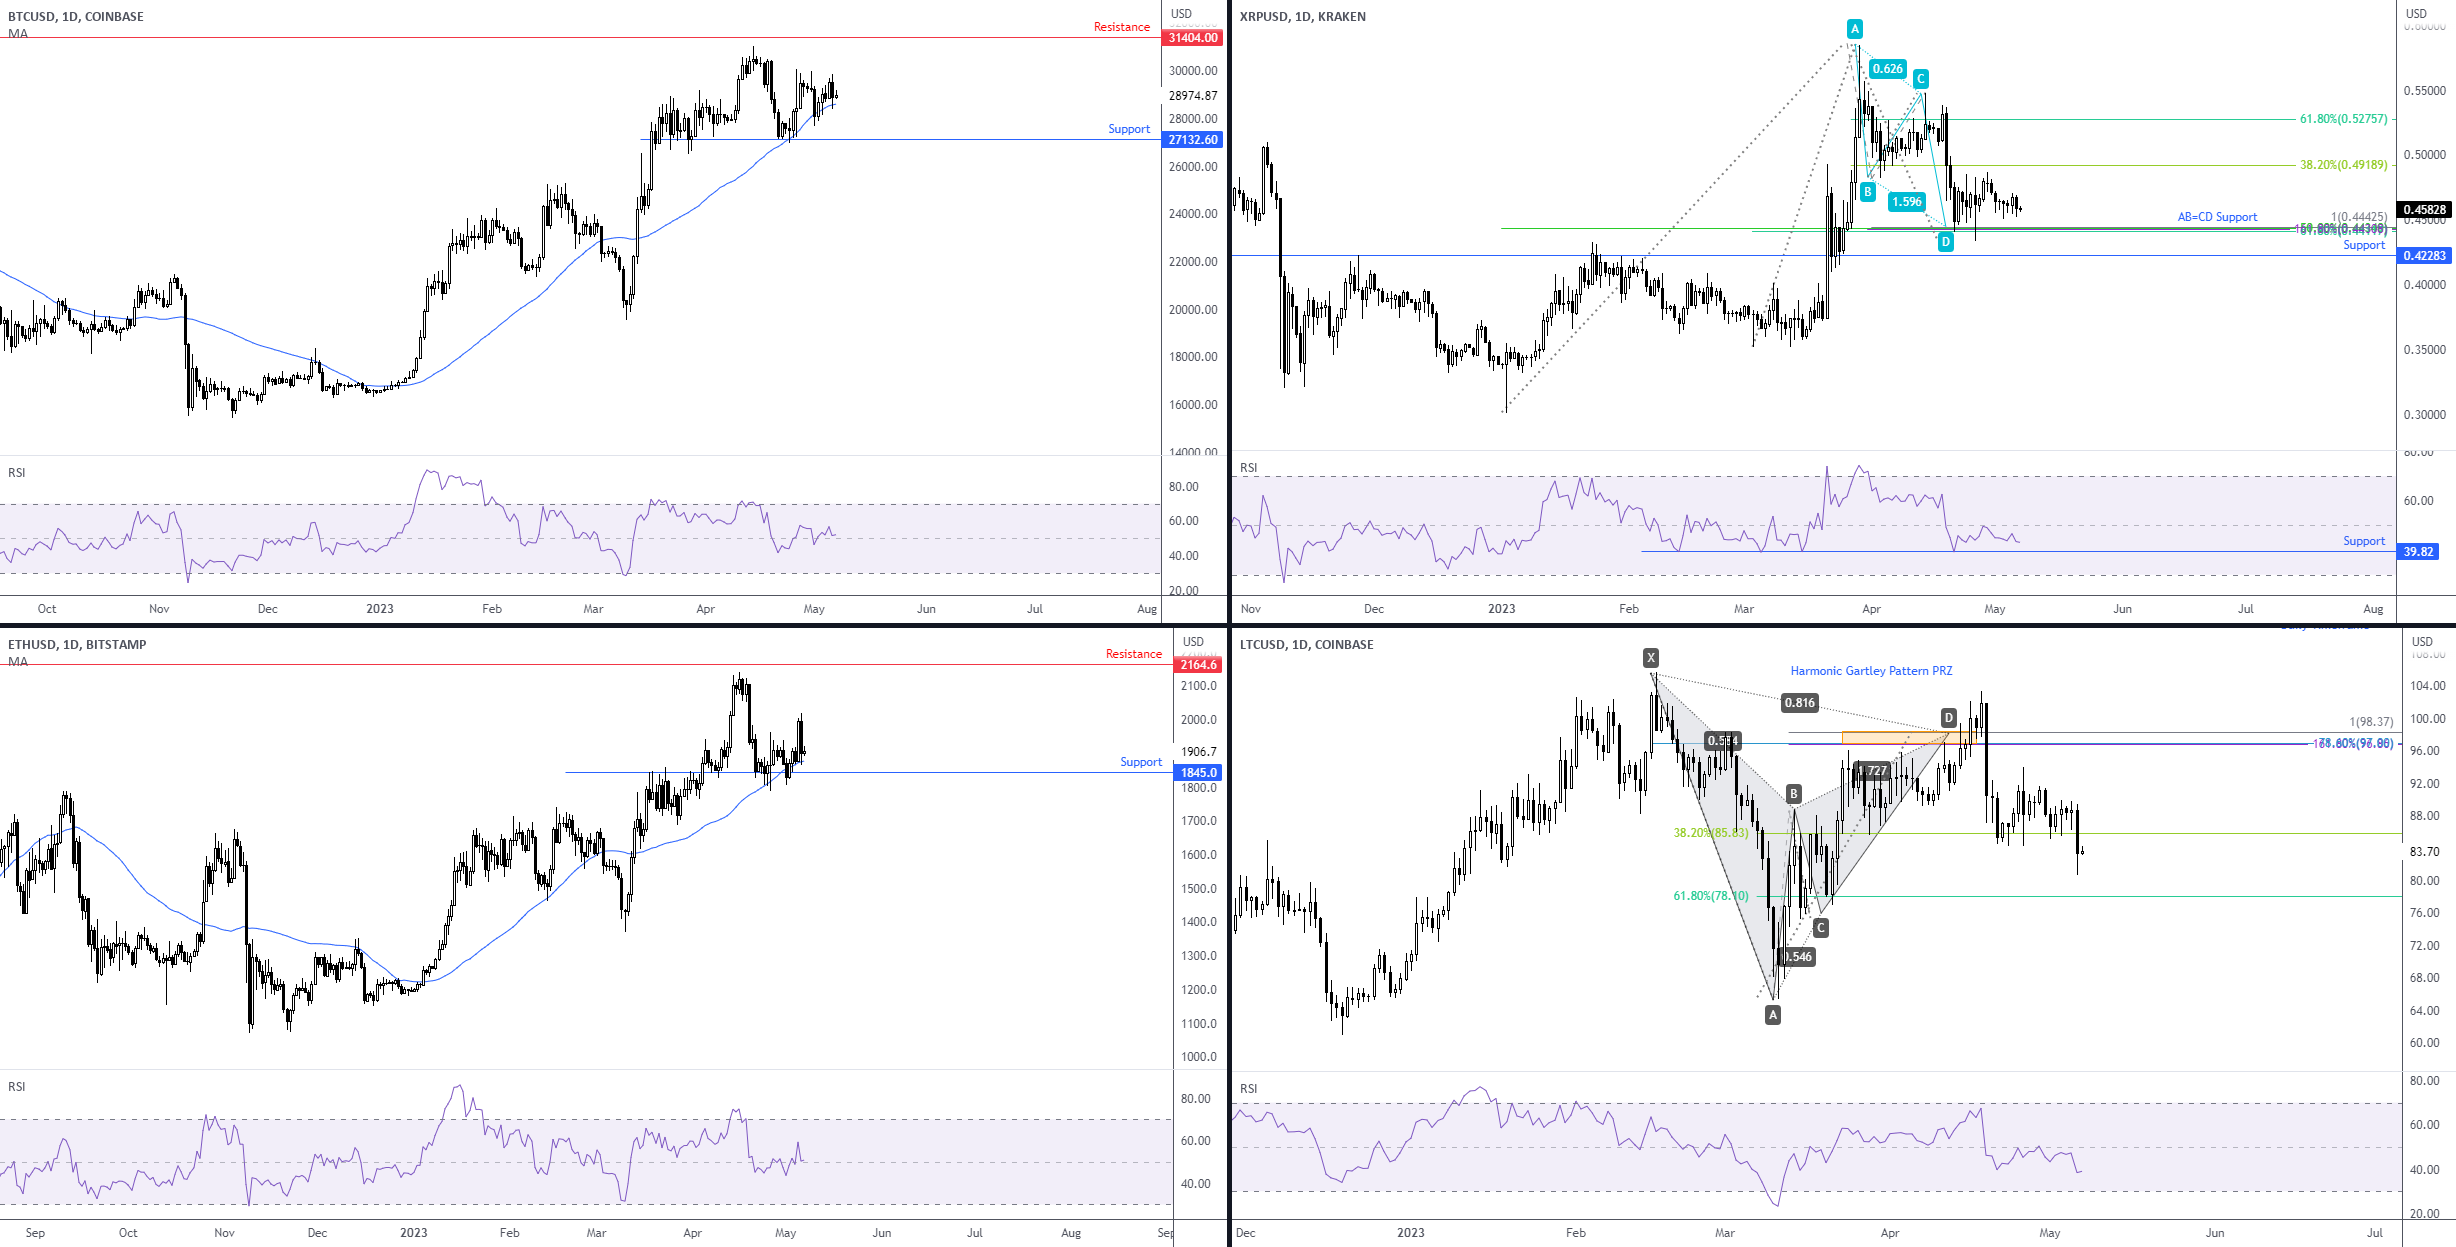
As evident from the daily timeframe of BTC/USD, the major cryptocurrency remains higher, trending north since bottoming in November 2022.Support from $27,132 was welcomed in late April, a move aided by the 50-day simple moving average of $28,563.Further buying also saw the Relative Strength Index (RSI) reclaim 50.00+ territory.As such, chart studies suggest additional outperformance, targeting fresh year-to-date highs and resistance from $31,404.
ETH/USD:
ETH/USD is echoing a similar vibe to BTC/USD.The trend on the daily timeframe is north, and price movement recently recoiled from support at $1,845.
This was bolstered by additional confluence: dynamic support from the 50-day simple moving average at $1,875 and the RSI regaining position north of the 50.00 centreline.Overall, the unit finished the week well, unbolting the door for fresh year-to-date peaks and a run to resistance at $2,164.
XRP/USD:
As seen from the daily timeframe of XRP/USD, price shook hands with AB=CD support in late April and has been rudderless since, consequently ranging between $0.4475 and $0.4806.
AB=CD support is denoted by a 100% projection at $0.4443.
The chart illustrates that the structure is complemented by a Fibonacci cluster around $0.4429 and RSI support at 39.82 (note, however, that the RSI remains below 50.00 ).Technical expectations call for at least a test of the 38.2% Fibonacci retracement overhead at $0.4919 and maybe even the 61.8% Fibonacci retracement at $0.5276 (derived from legs A-D).The aforementioned Fibonacci ratios are commonly targeted following the completion of an AB=CD pattern.
Failure to maintain support at current prices could lead to a test of familiar support at $0.4228, a level boasting historical significance since June 2022.
LTC/USD:
You may recall that I highlighted the completion of a daily harmonic Gartley pattern on LTC/USD in recent analysis.The pattern’s Potential Reversal Zone (PRZ) was between $98.37 and $96.90.While price did exceed this area, it failed to trade beyond the pattern’s X-point: the high of $105.69 (16 February); traditional rules of engagement would have traders/investors position stops beyond the X-point.
Like the AB=CD structure in XRP/USD, traders often target 38.2% and 61.8% Fibonacci retracements (taken from legs A-D); you will note that price tested the 38.2% Fibonacci level in April at $85.83, with many Gartley traders possibly reducing risk to breakeven at this point and taking partial profits.Many will also likely look for further downside, targeting the 61.8% Fibonacci level at $78.10 as a final take-profit objective.
The RSI remains under its 50.00 centreline: negative momentum.
As evident from the daily timeframe of BTC/USD, the major cryptocurrency remains higher, trending north since bottoming in November 2022.
Support from $27,132 was welcomed in late April, a move aided by the 50-day simple moving average of $28,563.Further buying also saw the Relative Strength Index (RSI) reclaim 50.00+ territory.As such, chart studies suggest additional outperformance, targeting fresh year-to-date highs and resistance from $31,404.
ETH/USD:
ETH/USD is echoing a similar vibe to BTC/USD.The trend on the daily timeframe is north, and price movement recently recoiled from support at $1,845.
This was bolstered by additional confluence: dynamic support from the 50-day simple moving average at $1,875 and the RSI regaining position north of the 50.00 centreline.Overall, the unit finished the week well, unbolting the door for fresh year-to-date peaks and a run to resistance at $2,164.
XRP/USD:
As seen from the daily timeframe of XRP/USD, price shook hands with AB=CD support in late April and has been rudderless since, consequently ranging between $0.4475 and $0.4806.
AB=CD support is denoted by a 100% projection at $0.4443.The chart illustrates that the structure is complemented by a Fibonacci cluster around $0.4429 and RSI support at 39.82 (note, however, that the RSI remains below 50.00 ).Technical expectations call for at least a test of the 38.2% Fibonacci retracement overhead at $0.4919 and maybe even the 61.8% Fibonacci retracement at $0.5276 (derived from legs A-D).The aforementioned Fibonacci ratios are commonly targeted following the completion of an AB=CD pattern.
Failure to maintain support at current prices could lead to a test of familiar support at $0.4228, a level boasting historical significance since June 2022.
LTC/USD:
You may recall that I highlighted the completion of a daily harmonic Gartley pattern on LTC/USD in recent analysis.
The pattern’s Potential Reversal Zone (PRZ) was between $98.37 and $96.90.While price did exceed this area, it failed to trade beyond the pattern’s X-point: the high of $105.69 (16 February); traditional rules of engagement would have traders/investors position stops beyond the X-point.
Like the AB=CD structure in XRP/USD, traders often target 38.2% and 61.8% Fibonacci retracements (taken from legs A-D); you will note that price tested the 38.2% Fibonacci level in April at $85.83, with many Gartley traders possibly reducing risk to breakeven at this point and taking partial profits.Many will also likely look for further downside, targeting the 61.8% Fibonacci level at $78.10 as a final take-profit objective.
The RSI remains under its 50.00 centreline: negative momentum.
Disclaimer
The information and publications are not meant to be, and do not constitute, financial, investment, trading, or other types of advice or recommendations supplied or endorsed by TradingView.Read more in the
[Terms of Use](/policies/#disclaimer-regarding-investment-decisions-and-trading)..