 [](/u/Ritika_TCR/)
Sand Crypto
[CRYPTO:SANDUSD](/symbols/SANDUSD/)The Sandbox
Can The Sandbox Crypto Continue To Register Gains In April 2024?
At press time, The Sandbox crypto was trading close to $0.692, recording a sift intraday gain of 1.28%.
The whales holdings noted a significant drop of nearly 3.5% in the last three weeks.
The Sandbox crypto got the buyers back after losing in the morning session and is attempting for a recovery.The price took a rebound from the 20 day EMA and surged higher to recover yesterday’s losses.
Moreover, the SAND crypto noted a sharp selling in Intraday on Wednesday and failed to capitalize the gaining streak of previous five intraday sessions.The SAND price fell nearly 5.3% in Intraday yesterday however could not close below the dynamic support of 20 day EMA.
The SAND crypto is up nearly 1.28% after recovering from the morning losses and trades close to 0.692 USD.The trend outlook is positive and the bulls are attempting for a recovery in Intraday.
The Sandbox Crypto Volume Analysis
The Sandbox chart reveals the relationship between the SAND token’s volume and price.While observing the chart closely, it was noted that both asset volume and price dropped in January.
That meant a lack of interest and activity in the market for the SAND token.The average volumes were mostly under 150 Million USD and the price was hovering close to 0.45 USD.
Moreover, the SAND crypto price and volume surged in February, indicating increased demand and excitement.The trading volume exceeded 200 Million USD and the price rose drastically from 0.45 to 0.8 USD.
Looking about the recent data the price and volume both dropped in the last couple of weeks indicating a profit booking.
Whale Holdings Saw A Significant Selloff: What’s Next?
The above chart illustrates a correlation between the SAND crypto price along with the changes in the supply held by the top addresses.
It is important to study the behavior of large wallets or top addresses.It gives an idea about what the top addresses are doing at the moment whether they are buying or selling the crypto.
The holdings of top addresses remained almost constant with a mere drop of 0.1% from December 2023 to February 2024 and was maintained at 71.30%.However, a significant selloff was noted in the large wallets in the 1st two weeks of March after the price reached at higher levels.The whale holdings have dropped to 67.8 as of now recording a significant 3.5% drop.
The SAND Crypto Technical Outlook
At the time of writing, the RSI line was placed slightly higher than the mean line at 54.55 points.Whereas, the SMA line was hovering close to the mean line at 51.47 points.Both the RSI and mean line were hovering higher than the mean line and a bullish crossover was observed on the charts, suggesting a positive outlook in the near term.
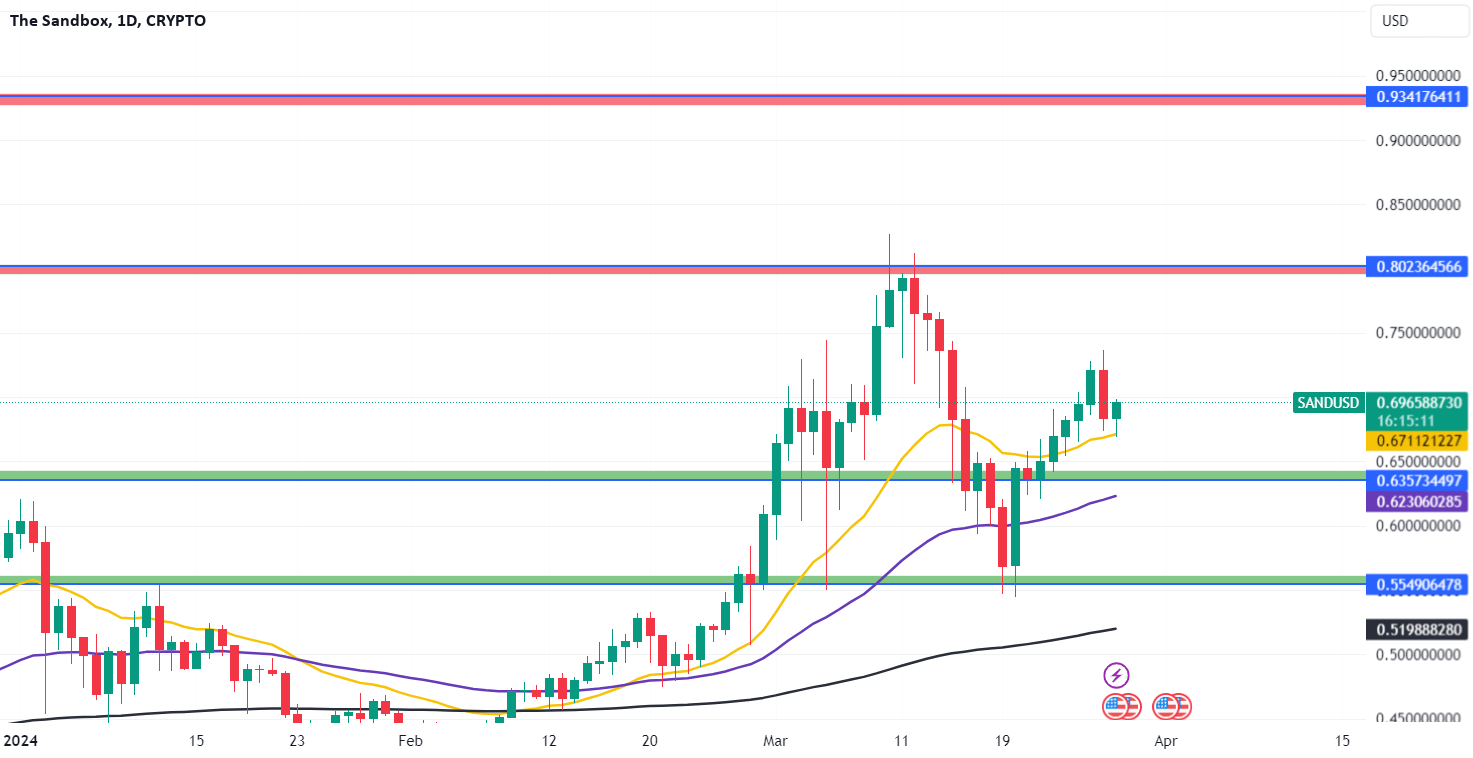
Also, the EMA study shows that the price took a rebound from the 50 day exponential moving average and jumped higher suggesting a bullish outlook in the short term.Also, the price and the short term EMA are placed higher than the 200 day EMA indicating a strong outlook in the long term as well.
The Sandbox Crypto Price Prediction April 2024.
On the most bullish observation, The Sandbox crypto could rise to a high of $0.934 by the end of April 2024.On the flip side, the most pessimistic prediction of our analysts is for the price to break below the 50 day EMA at $0.62 level after which the price may fall to $0.55 level.
Conclusion.
The Sandbox crypto got the support of buyers in Intraday and is up for a recovery.
The price bounced back after retracing the 20 day EMA suggests the presence of the buyers at the lower levels.
The short term trend as well as the long term trend outlook is positive which may keep the price driving higher.The price prediction shows that the crypto could attain a high of $0.934 by next month.However, a significant selloff of nearly 3.5% was noted in the top addresses which might be a concern for the buyers.
Technical levels:
Support levels: $0.635 and $0.554
Resistance levels: $0.802 and $0.934
Disclaimer
The views and opinions stated by the author, or any people named in this article, are for informational purposes only and do not establish financial, investment, or other advice.Investing in or trading crypto or stock comes with a risk of financial loss.
At press time, The Sandbox crypto was trading close to $0.692, recording a sift intraday gain of 1.28%.
The whales holdings noted a significant drop of nearly 3.5% in the last three weeks.
The Sandbox crypto got the buyers back after losing in the morning session and is attempting for a recovery.The price took a rebound from the 20 day EMA and surged higher to recover yesterday’s losses.
Moreover, the SAND crypto noted a sharp selling in Intraday on Wednesday and failed to capitalize the gaining streak of previous five intraday sessions.The SAND price fell nearly 5.3% in Intraday yesterday however could not close below the dynamic support of 20 day EMA.
The SAND crypto is up nearly 1.28% after recovering from the morning losses and trades close to 0.692 USD.The trend outlook is positive and the bulls are attempting for a recovery in Intraday.
The Sandbox Crypto Volume Analysis
The Sandbox chart reveals the relationship between the SAND token’s volume and price.While observing the chart closely, it was noted that both asset volume and price dropped in January.
That meant a lack of interest and activity in the market for the SAND token.The average volumes were mostly under 150 Million USD and the price was hovering close to 0.45 USD.
Moreover, the SAND crypto price and volume surged in February, indicating increased demand and excitement.The trading volume exceeded 200 Million USD and the price rose drastically from 0.45 to 0.8 USD.
Looking about the recent data the price and volume both dropped in the last couple of weeks indicating a profit booking.
Whale Holdings Saw A Significant Selloff: What’s Next?
The above chart illustrates a correlation between the SAND crypto price along with the changes in the supply held by the top addresses.It is important to study the behavior of large wallets or top addresses.It gives an idea about what the top addresses are doing at the moment whether they are buying or selling the crypto.
The holdings of top addresses remained almost constant with a mere drop of 0.1% from December 2023 to February 2024 and was maintained at 71.30%.However, a significant selloff was noted in the large wallets in the 1st two weeks of March after the price reached at higher levels.
The whale holdings have dropped to 67.8 as of now recording a significant 3.5% drop.
The SAND Crypto Technical Outlook
At the time of writing, the RSI line was placed slightly higher than the mean line at 54.55 points.Whereas, the SMA line was hovering close to the mean line at 51.47 points.Both the RSI and mean line were hovering higher than the mean line and a bullish crossover was observed on the charts, suggesting a positive outlook in the near term.
Also, the EMA study shows that the price took a rebound from the 50 day exponential moving average and jumped higher suggesting a bullish outlook in the short term.Also, the price and the short term EMA are placed higher than the 200 day EMA indicating a strong outlook in the long term as well.
The Sandbox Crypto Price Prediction April 2024.
On the most bullish observation, The Sandbox crypto could rise to a high of $0.934 by the end of April 2024.On the flip side, the most pessimistic prediction of our analysts is for the price to break below the 50 day EMA at $0.62 level after which the price may fall to $0.55 level.
Conclusion.
The Sandbox crypto got the support of buyers in Intraday and is up for a recovery.The price bounced back after retracing the 20 day EMA suggests the presence of the buyers at the lower levels.
The short term trend as well as the long term trend outlook is positive which may keep the price driving higher.
The price prediction shows that the crypto could attain a high of $0.934 by next month.However, a significant selloff of nearly 3.5% was noted in the top addresses which might be a concern for the buyers.
Technical levels:
Support levels: $0.635 and $0.554
Resistance levels: $0.802 and $0.934
Disclaimer
The views and opinions stated by the author, or any people named in this article, are for informational purposes only and do not establish financial, investment, or other advice.Investing in or trading crypto or stock comes with a risk of financial loss.
Disclaimer
The information and publications are not meant to be, and do not constitute, financial, investment, trading, or other types of advice or recommendations supplied or endorsed by TradingView.Read more in the
[Terms of Use](/policies/#disclaimer-regarding-investment-decisions-and-trading)..