 [](/u/AXiVenture/)
Unveiling a New WLD: Charting the Crypto Frontier
[BINGX:WLDUSDT.PS](/symbols/WLDUSDT.PS/)WLD/USDT
In the vibrant and ever-changing cryptocurrency sector, the WLD coin has emerged as a noteworthy entity, particularly due to its meteoric rise from a trading stance of $0.9850 to an impressive peak at $11.
This analysis delves into the intricacies of WLD’s market behavior, with a keen focus on a specific 3-hour trading window.It methodically dissects the coin’s historical pricing patterns, leverages a spectrum of technical analysis tools, and contemplates the broader market forces that have been instrumental in sculpting WLD’s path.
Background Overview:
WLD coin’s journey began with its release on July 24, 2024, marked by the innovative introduction of 11 ORB locations across the United States, with an ambitious roadmap extending to 35 more ORBs globally.The coin’s debut saw an initial 8.5% price increase, subsequently experiencing a 35% decline from its peak, setting the stage for a complex market trajectory
Analytical Perspective:
This analysis adopts a personal viewpoint, acknowledging the subjective nature of technical analysis and inviting diverse perspectives to enrich the discussion.Despite a bullish outlook on WLD, a potential overvaluation and expected price correction are considered, with analysis extending beyond the 3-hour timeframe to encompass broader market trends.
Technical Analysis:
The technical journey of WLD began post its initial rally and subsequent decline, finding support at the $1.8599 level, which held for approximately 16 days.
A breach of this support level led to a further decline, establishing $0.9850 as a significant support area, indicative of strong buying levels.
A minor Area of Interest (AOI) was identified at $1.2335, with frequent interactions over a month, highlighting its importance in WLD’s price dynamics.
The downtrend witnessed on a shorter 1-hour timeframe and the oscillator’s indication of a potential reversal at this stage underscored the nuanced interplay of market forces on the 3H timeframe.
The emergence of a new uptrend was marked by a significant pattern on the oscillator, with WLD establishing new AOIs at $2.7365 and $4.3, leading to a remarkable 333% price rally.
However, this rally faced resistance, initiating a corrective phase that saw a 50% price reduction over 36 days, highlighting the cyclical nature of market trends.
A pivotal moment in WLD’s trading history was observed around the grey dotted Area of Interest (AOI) line at $2.1850.
On February 9, 2024, as the market opened (8:00 AM AUS GMT+8), buyers initiated a strong entry, effectively challenging and breaking through the prevailing downtrend.
This bullish momentum was clearly confirmed on the 3-hourly chart, marking a significant turning point in WLD’s market dynamics
In the subsequent 30-day trading period, an extraordinary price surge ensued, with WLD’s value escalating by over 384%.This period was characterized by the establishment of new AOIs at critical levels: $5.1205, marking the investor’s take-profit point, followed by successive peaks at $7.2215, $9.4795, $9.500, and ultimately reaching an all-time high at $11.8954.
This phase not only underscored the robust bullish sentiment in the market but also highlighted the strategic significance of these newly established AOIs in WLD’s trading landscape.
Current Market Dynamics:
Diving deeper into the intricate landscape of WLD’s price action, we now pivot our focus towards the horizon, contemplating the path that lies ahead based on the meticulous analysis of the 3-hour chart.
Navigating Future Waters: A Detailed Forecast
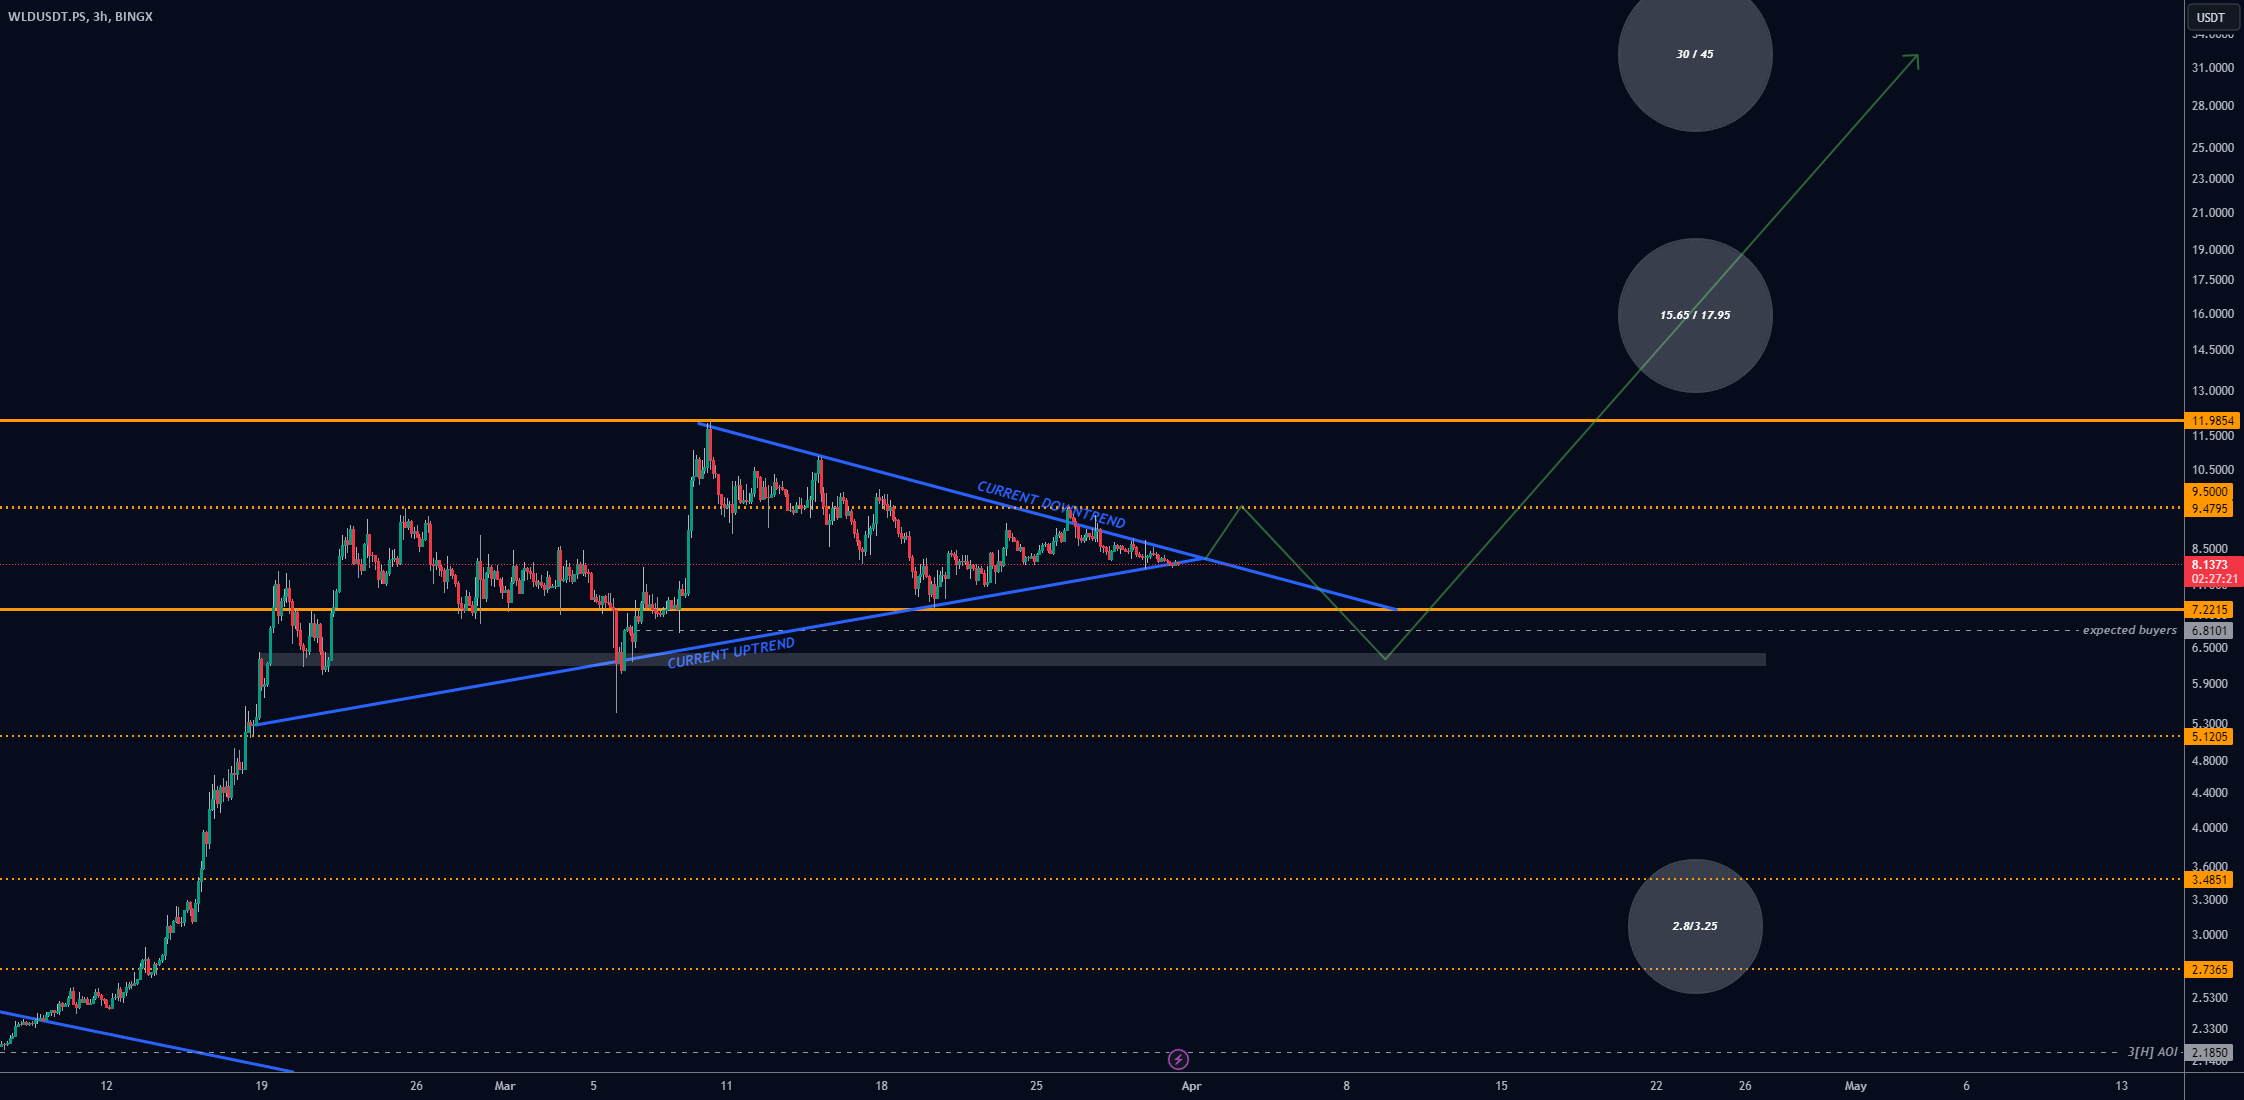
The symphony of price levels previously highlighted has not only shaped the historical narrative of WLD but now converges to orchestrate a symmetrical triangle pattern on the 3-hour timeframe.This geometric alignment, as observed below,
suggests a delicate balance between bullish hopes and bearish realities, typically indicative of a bullish continuation pattern.
However, the plot thickens as the oscillator reveals signs of capital withdrawal alongside a bearish cross, marked distinctly by a highlighted white dot
This is hinting at potential volatility with a predisposition to break downward before possibly catapulting upwards with renewed vigor, especially around the $6.81 – $6.3455 AOI zones or upon retesting the $8.5 AOI.
Anticipating strategic entry points, the levels at $7.2215 and $6.8101 emerge as beacons for potential investment opportunities, potentially setting the stage for WLD to eclipse its previous zeniths if these levels hold firm.
Leveraging ERAI’s Insights:
Employing ERAI, an AI-driven beacon in the tumultuous seas of cryptocurrency trading, we delve into a simulation rich with historical candle data.
This predictive odyssey suggests pivotal levels at $15.72, with notable clusters around $11.985, $8.57, $7.78, and $6.81, painting a cautious tapestry of potential downturns, with the minor level at $5.1205 offering a glimmer of optimism to hold price up.
ERAI’s bearish posture, amplified by a SELL signal at a power rating of 2.4 on the 3-hour timeframe, further accentuates the narrative of caution.
The Duel of Indicators:
Amidst this analytical maelstrom, the 200 daily EMA and the HODL line stand as sentinels on the chart, their red and white hues demarcating the battleground of buyers and sellers.This dynamic duo suggests a close-knit struggle for dominance, offering a strategic axiom: the positioning of the HODL line relative to the 200 DEMA could signal the opportune moments to buy or sell.
Oscillatory Perspectives:
Lastly, the oscillator, with its HYPER WAVE and MONEY FLOW, warns of negative cash influxes and descending price actions, suggesting a march towards the oversold domain, with eyes keenly set on the $7.2215 and $6.81 levels for potential rebounds.
In Summary:
This foray into WLD’s technical realm, grounded in empirical evidence and enriched by predictive analytics, paints a tapestry of cautious optimism, underscored by strategic vigilance.
Will be closely monitoring WLD for the next coming weeks.
~Axie
This analysis delves into the intricacies of WLD’s market behavior, with a keen focus on a specific 3-hour trading window.It methodically dissects the coin’s historical pricing patterns, leverages a spectrum of technical analysis tools, and contemplates the broader market forces that have been instrumental in sculpting WLD’s path.
Background Overview:
WLD coin’s journey began with its release on July 24, 2024, marked by the innovative introduction of 11 ORB locations across the United States, with an ambitious roadmap extending to 35 more ORBs globally.The coin’s debut saw an initial 8.5% price increase, subsequently experiencing a 35% decline from its peak, setting the stage for a complex market trajectory
Analytical Perspective:
This analysis adopts a personal viewpoint, acknowledging the subjective nature of technical analysis and inviting diverse perspectives to enrich the discussion.
Despite a bullish outlook on WLD, a potential overvaluation and expected price correction are considered, with analysis extending beyond the 3-hour timeframe to encompass broader market trends.
Technical Analysis:
The technical journey of WLD began post its initial rally and subsequent decline, finding support at the $1.8599 level, which held for approximately 16 days.
A breach of this support level led to a further decline, establishing $0.9850 as a significant support area, indicative of strong buying levels.
A minor Area of Interest (AOI) was identified at $1.2335, with frequent interactions over a month, highlighting its importance in WLD’s price dynamics.
The downtrend witnessed on a shorter 1-hour timeframe and the oscillator’s indication of a potential reversal at this stage underscored the nuanced interplay of market forces on the 3H timeframe.
The emergence of a new uptrend was marked by a significant pattern on the oscillator, with WLD establishing new AOIs at $2.7365 and $4.3, leading to a remarkable 333% price rally.
However, this rally faced resistance, initiating a corrective phase that saw a 50% price reduction over 36 days, highlighting the cyclical nature of market trends.
A pivotal moment in WLD’s trading history was observed around the grey dotted Area of Interest (AOI) line at $2.1850.On February 9, 2024, as the market opened (8:00 AM AUS GMT+8), buyers initiated a strong entry, effectively challenging and breaking through the prevailing downtrend.This bullish momentum was clearly confirmed on the 3-hourly chart, marking a significant turning point in WLD’s market dynamics
In the subsequent 30-day trading period, an extraordinary price surge ensued, with WLD’s value escalating by over 384%.This period was characterized by the establishment of new AOIs at critical levels: $5.1205, marking the investor’s take-profit point, followed by successive peaks at $7.2215, $9.4795, $9.500, and ultimately reaching an all-time high at $11.8954.
This phase not only underscored the robust bullish sentiment in the market but also highlighted the strategic significance of these newly established AOIs in WLD’s trading landscape.
Current Market Dynamics:
Diving deeper into the intricate landscape of WLD’s price action, we now pivot our focus towards the horizon, contemplating the path that lies ahead based on the meticulous analysis of the 3-hour chart.
Navigating Future Waters: A Detailed Forecast
The symphony of price levels previously highlighted has not only shaped the historical narrative of WLD but now converges to orchestrate a symmetrical triangle pattern on the 3-hour timeframe.
This geometric alignment, as observed below,
suggests a delicate balance between bullish hopes and bearish realities, typically indicative of a bullish continuation pattern.
However, the plot thickens as the oscillator reveals signs of capital withdrawal alongside a bearish cross, marked distinctly by a highlighted white dot
This is hinting at potential volatility with a predisposition to break downward before possibly catapulting upwards with renewed vigor, especially around the $6.81 – $6.3455 AOI zones or upon retesting the $8.5 AOI.
Anticipating strategic entry points, the levels at $7.2215 and $6.8101 emerge as beacons for potential investment opportunities, potentially setting the stage for WLD to eclipse its previous zeniths if these levels hold firm.
Leveraging ERAI’s Insights:
Employing ERAI, an AI-driven beacon in the tumultuous seas of cryptocurrency trading, we delve into a simulation rich with historical candle data.This predictive odyssey suggests pivotal levels at $15.72, with notable clusters around $11.985, $8.57, $7.78, and $6.81, painting a cautious tapestry of potential downturns, with the minor level at $5.1205 offering a glimmer of optimism to hold price up.
ERAI’s bearish posture, amplified by a SELL signal at a power rating of 2.4 on the 3-hour timeframe, further accentuates the narrative of caution.
The Duel of Indicators:
Amidst this analytical maelstrom, the 200 daily EMA and the HODL line stand as sentinels on the chart, their red and white hues demarcating the battleground of buyers and sellers.This dynamic duo suggests a close-knit struggle for dominance, offering a strategic axiom: the positioning of the HODL line relative to the 200 DEMA could signal the opportune moments to buy or sell.
Oscillatory Perspectives:
Lastly, the oscillator, with its HYPER WAVE and MONEY FLOW, warns of negative cash influxes and descending price actions, suggesting a march towards the oversold domain, with eyes keenly set on the $7.2215 and $6.81 levels for potential rebounds.
In Summary:
This foray into WLD’s technical realm, grounded in empirical evidence and enriched by predictive analytics, paints a tapestry of cautious optimism, underscored by strategic vigilance.
Will be closely monitoring WLD for the next coming weeks.
~Axie
Disclaimer
The information and publications are not meant to be, and do not constitute, financial, investment, trading, or other types of advice or recommendations supplied or endorsed by TradingView.Read more in the
[Terms of Use](/policies/#disclaimer-regarding-investment-decisions-and-trading)..